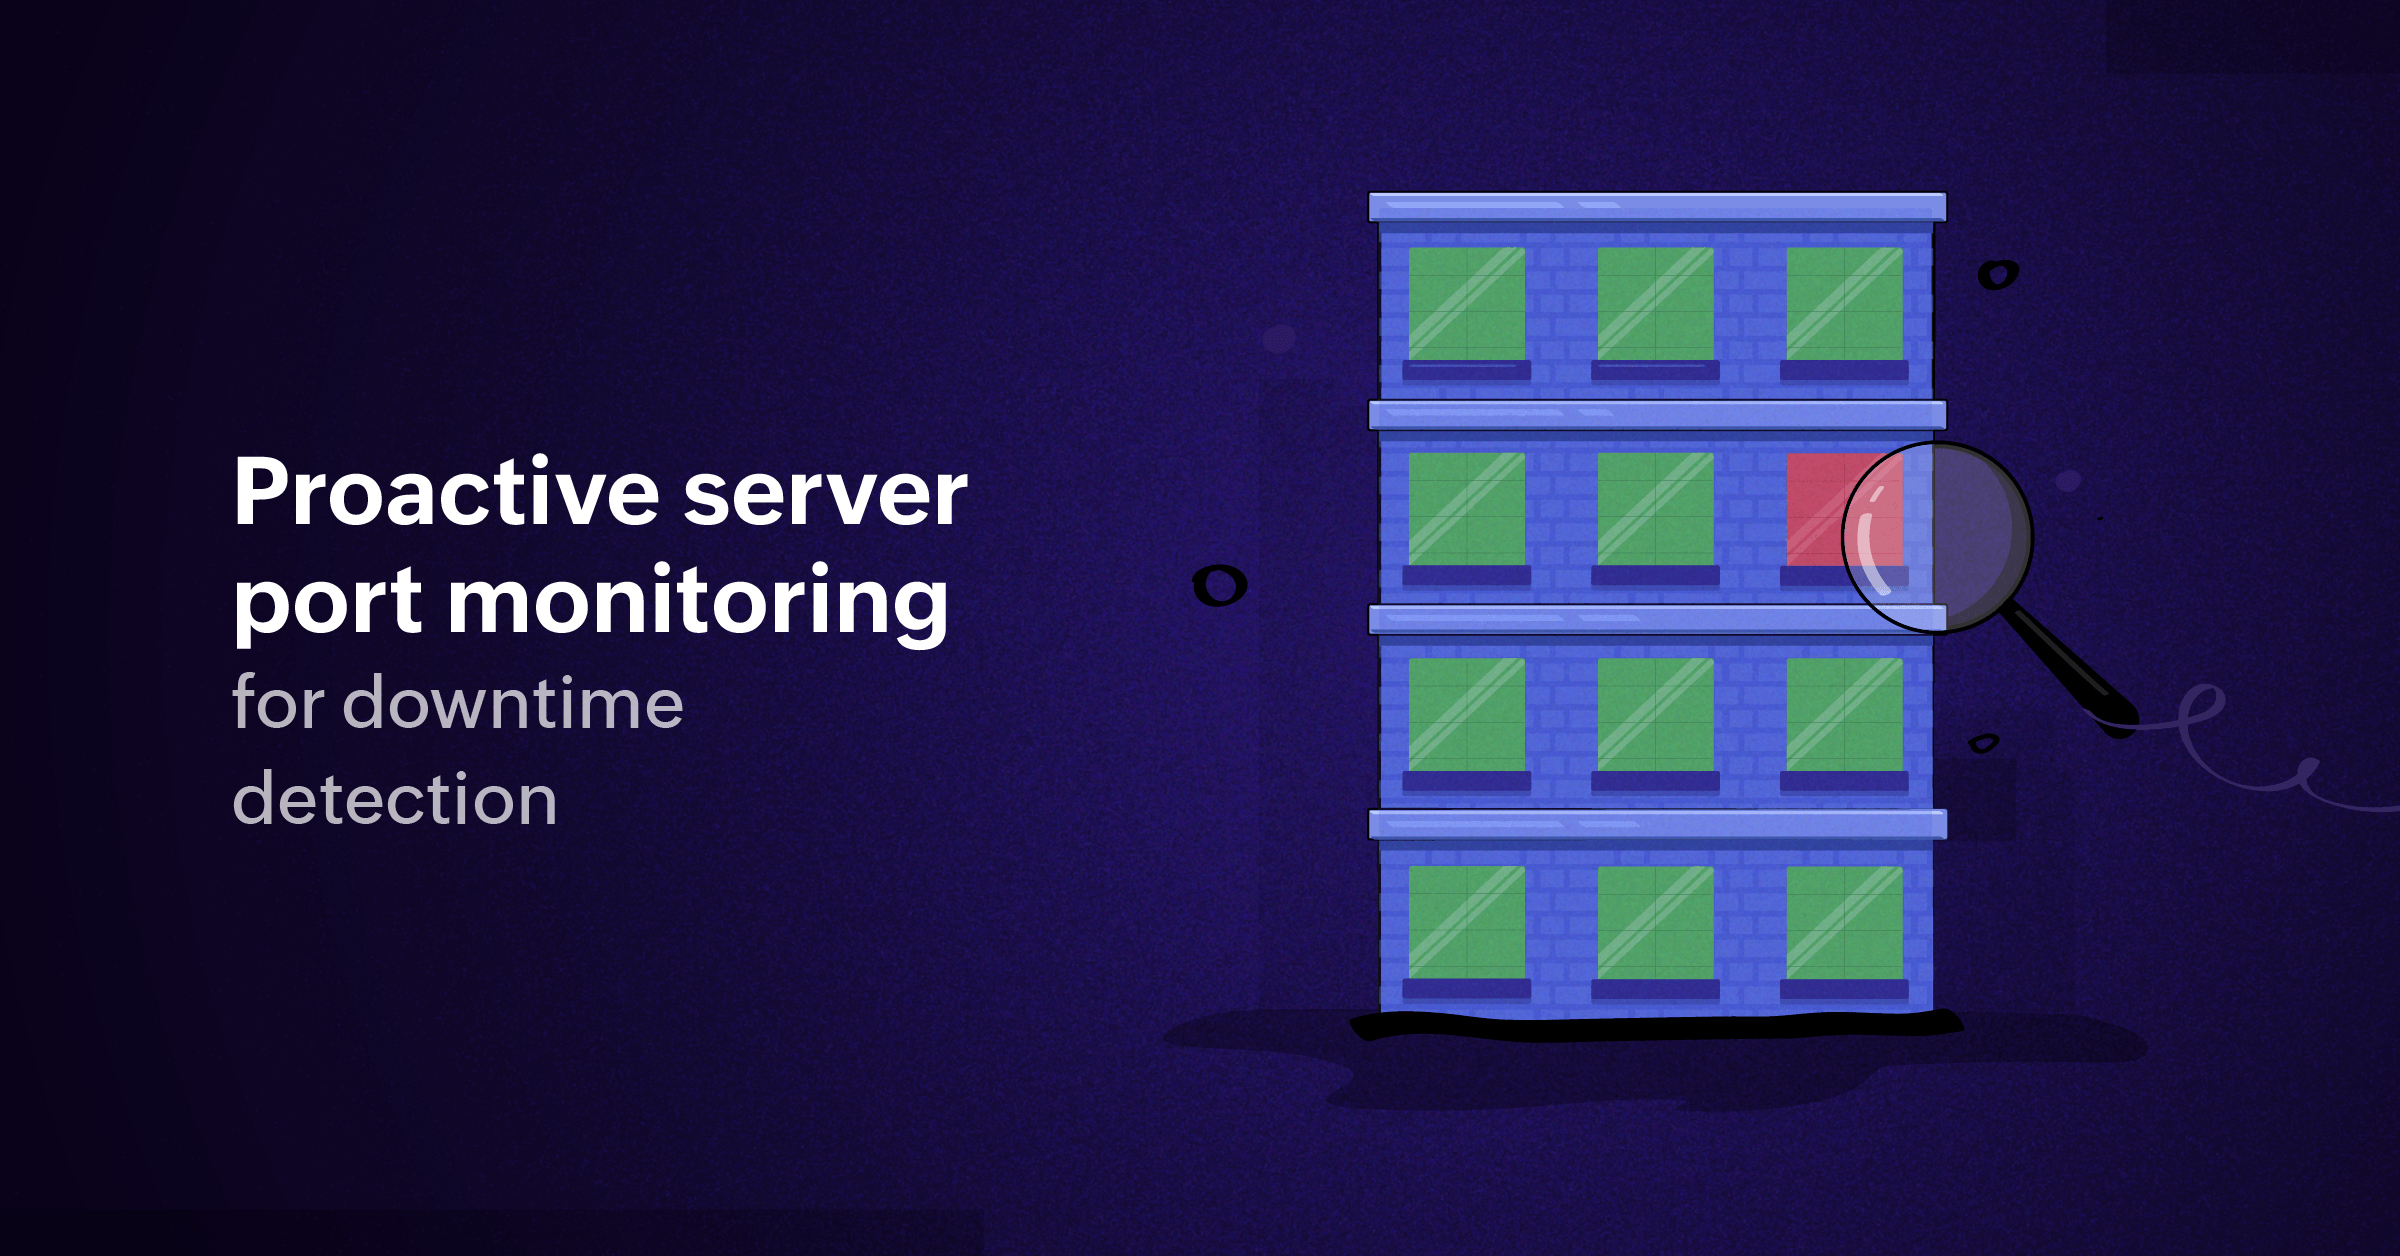
Proactive server port monitoring for downtime detection
If your organization runs on tech, everyday issues can be expected. This includes application downtime, erratic connectivity, and failures in remote access, database reachability, site-to-site VPNs, and web-based services. But how do you know if an issue is caused by:
- An outage by the service provider,
- A misconfiguration in your server,
- An overprotective firewall,
- Or a crinkled cable?
Sysadmins usually learn the root cause of an issue after a ticket comes in from the team or customer. This is because multiple, differing issues in IT infrastructure will share the same symptoms, showing themselves as a single cause: an outage or sluggish performance. These symptoms can include anything from transactions timing out, APIs being unavailable, and devices showing Server not found errors.
Scenarios like these waste valuable hours in root cause analysis. In reality, one alert can immediately streamline the troubleshooting process—Port XYZ is down.
In enterprise settings, one failed port can create routing issues, forcing traffic through suboptimal paths while degrading overall network health. Unless actively monitored, admins may only learn of the problem when business services grind to a halt or critical alerts reach stakeholders far too late.
One port down could mean:
- Unavailable server applications or websites, even though all internal diagnostics appear normal.
- Failed remote access or site-to-site VPNs, where the real culprit is a blocked or unresponsive port.
- Sudden loss of database or storage connectivity, traced hours later to a failed switch or router port.
These scenarios waste valuable hours in root cause analysis which could be saved by knowing immediately when a port goes down.
Port down monitor by Site24x7

Server port down monitor is an integrated feature in Site24x7's server monitor.
Site24x7’s Resource Check Profile includes a port check feature, enabling technical teams to monitor and test the availability of key TCP/UDP ports in servers. With continuous health checks and instant alerting, Site24x7 helps pinpoint port outages before they critically impact operations.
Sysadmins simply specify target ports (like 443, 80, 1433, or custom app ports), set alert thresholds, and configure notification channels.
How to set up a port availability monitor
- Log in to your Site24x7 account and go to Admin > Server Monitor > Resource Check Profile > Create Resource Check Profile > Port Check.
- Specify the Port Number to be monitored (e.g., 443 for HTTPS, 1433 for SQL Server, 22 for SSH). The ports can range from 0 to 65535. Duplicate ports cannot be added to the same Resource Check Profile.
When a port goes down, Site24x7’s immediately sends an alert, giving technical teams the head start they need to resolve the issue before users notice. Engineers can finally focus troubleshooting where it matters—restoring services faster and preventing repeat incidents with continuous, hands-off port monitoring.
Comments (0)