Performance metrics for the Application Cluster Monitor
Interpreting Application Cluster Monitor results
The Application Cluster Monitor in Site24x7 helps you gain complete visibility into the performance and availability of your clustered application environments. Whether you're managing an application that has multiple endpoint URLs, this monitor aggregates data from individual applications and presents a unified view of cluster health.
The performance metrics are classified into the below tabs:
- Summary
- Outages
- Inventory
- Log Report
Summary
The Summary tab offers a comprehensive snapshot of your application’s cluster Availability, Response Time, and Failed Cluster Count over a selected period. This helps you identify performance trends and detect potential issues at a glance.
| Metrics | Description |
| Availability | Displays the percentage of time the monitored application cluster was available during the selected time frame. A 100% value indicates uninterrupted service. |
| Response Time | Shows the average response time (in milliseconds) of the application cluster for the chosen period. |
| Failed Cluster Count | Displays the number of clusters that failed out of the total configured clusters. This helps quickly identify component-level failures. |
-
Events Timeline
The Events Timeline records all the past events of your selected monitor for a specified time range. You can use this to identify and decode various past events, including those labeled as Down, Critical, Trouble, Maintenance, Suspended, or Anomaly. Each event is color-coded for easy identification. Events can be drilled down to extract maximum data and facilitate easy troubleshooting. You can also track the actual outage period and the total outage duration during a specific block of time. -
Response Time
The Response Time chart displays latency trends for each monitored URL within your cluster. In this view, each line represents a different cluster. Click the hamburger icon to adjust the graph’s appearance by changing the time unit, milestones, and moving point average. Additionally, you can view the response time in a separate tab, known as the Performance Report, by clicking on the Performance
 Graph icon.

-
Response Time by Location
Response Time by Location graph shows the average and 95th percentile response time(s) for the chosen time period from your selected monitoring locations. For raw data, the average value is derived by using all the data collection checks. For hourly data, the average data is derived using the hourly poll count. Location legends allow you to isolate individual response times based on locations.
-
Global Status
The Global Status section provides a consolidated view of the monitor's health across multiple configured locations. It enables you to quickly assess if the monitored resource is reachable and performing as expected from different geographies.
To modify the existing locations, click the Edit Locations link. Clicking on an individual location will display the Availability Summary Report.

-
Cluster-based Availability Report by Location
The Cluster-based Availability Report by Location offers a detailed comparison of response time and availability for each monitored cluster across configured locations. This helps in identifying region-specific performance variations and ensures that your application maintains consistent behavior globally. Each row represents a monitored cluster, while columns display metrics specific to each location, making it easy to track trends and spot anomalies in different regions.

Outages
You can access the Outages tab in your monitor's details page to gather detailed insights on the various outage and maintenance downtime. It provides you with sufficient information to troubleshoot issues.
You'll also be able to access the root cause analysis reports for your various outages. Upon accessing the hamburger ![]() icon of a listed monitor outage or maintenance, you'll be shown options to:
icon of a listed monitor outage or maintenance, you'll be shown options to:
- Mark as Maintenance: Mark an outage as maintenance.
- Mark as Downtime: Mark maintenance as downtime.
- Edit Comments: Add/edit comments.
- Delete: Delete an outage or maintenance permanently.

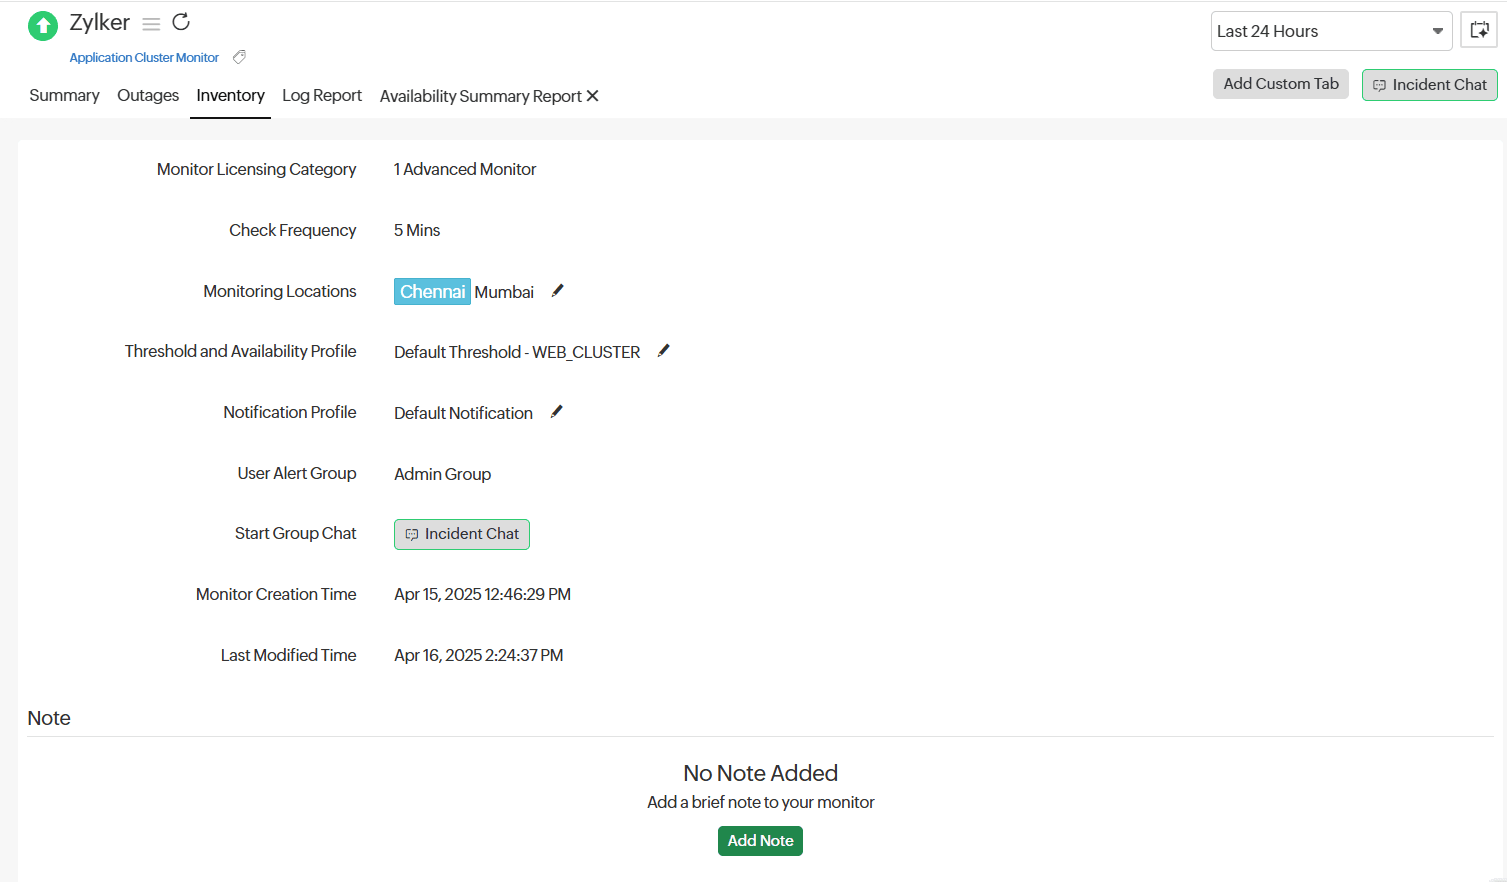
Inventory
This section captures the basic monitor information and its various configuration settings, including licensing type, monitoring locations, thresholds, and more. You can also add a note and start an incident chat by clicking the Incident Chat button.

Log Report
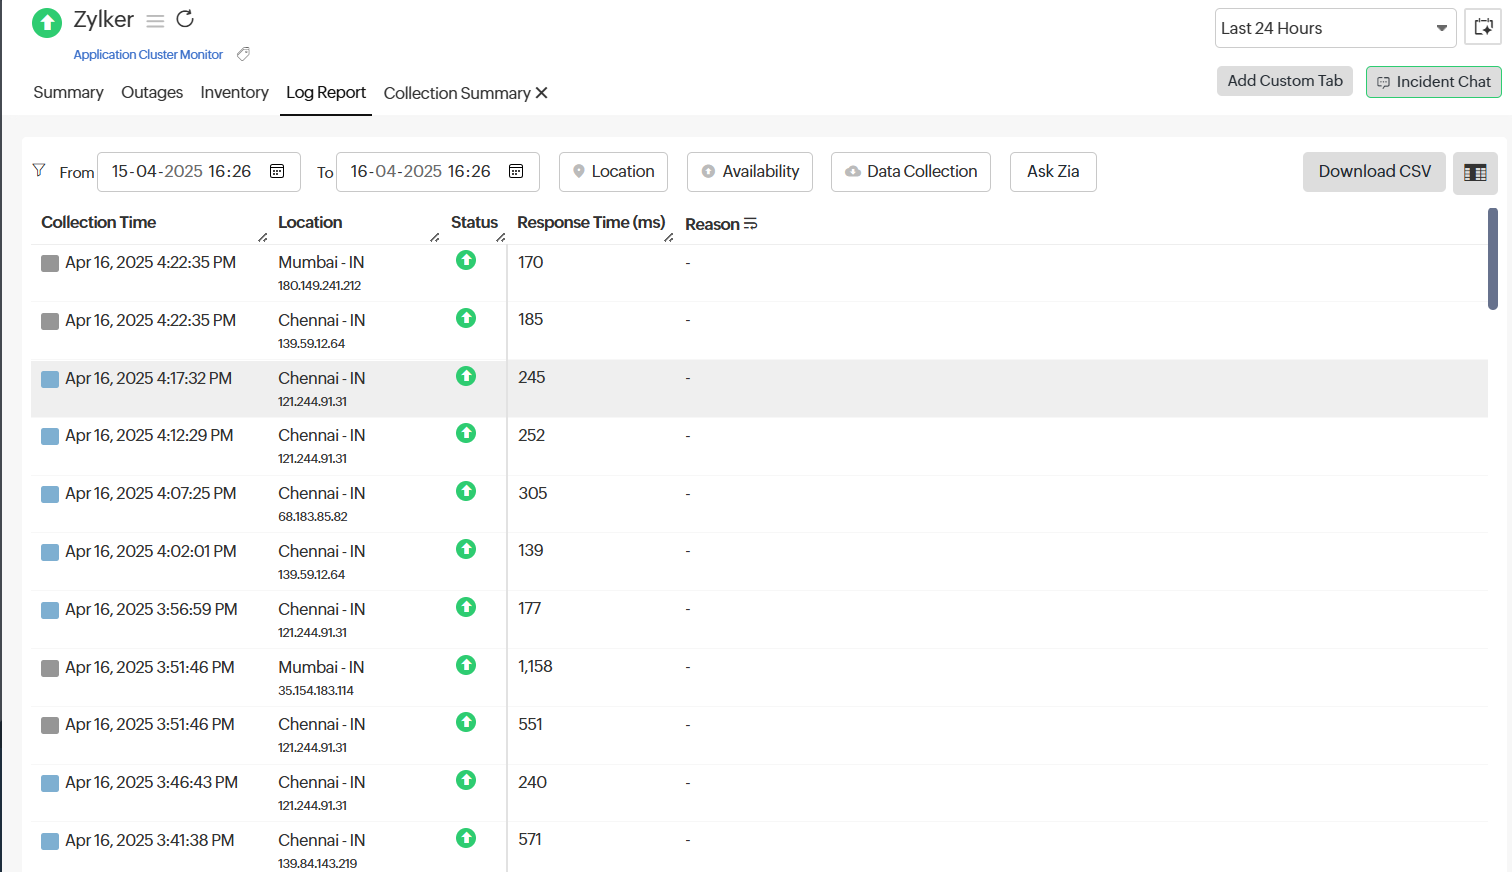
With our integrated log records for individual monitors, you can get in-depth knowledge about the various log details for the configured monitor over a custom period. You can also filter the log based on location and availability. Various data including availability status, HTTP status codes, DNS response times, etc. are captured here. You can also export the log report in CSV format.

Clicking the desired row in the Log Report will take you to the Collection Summary.
Collection Summary
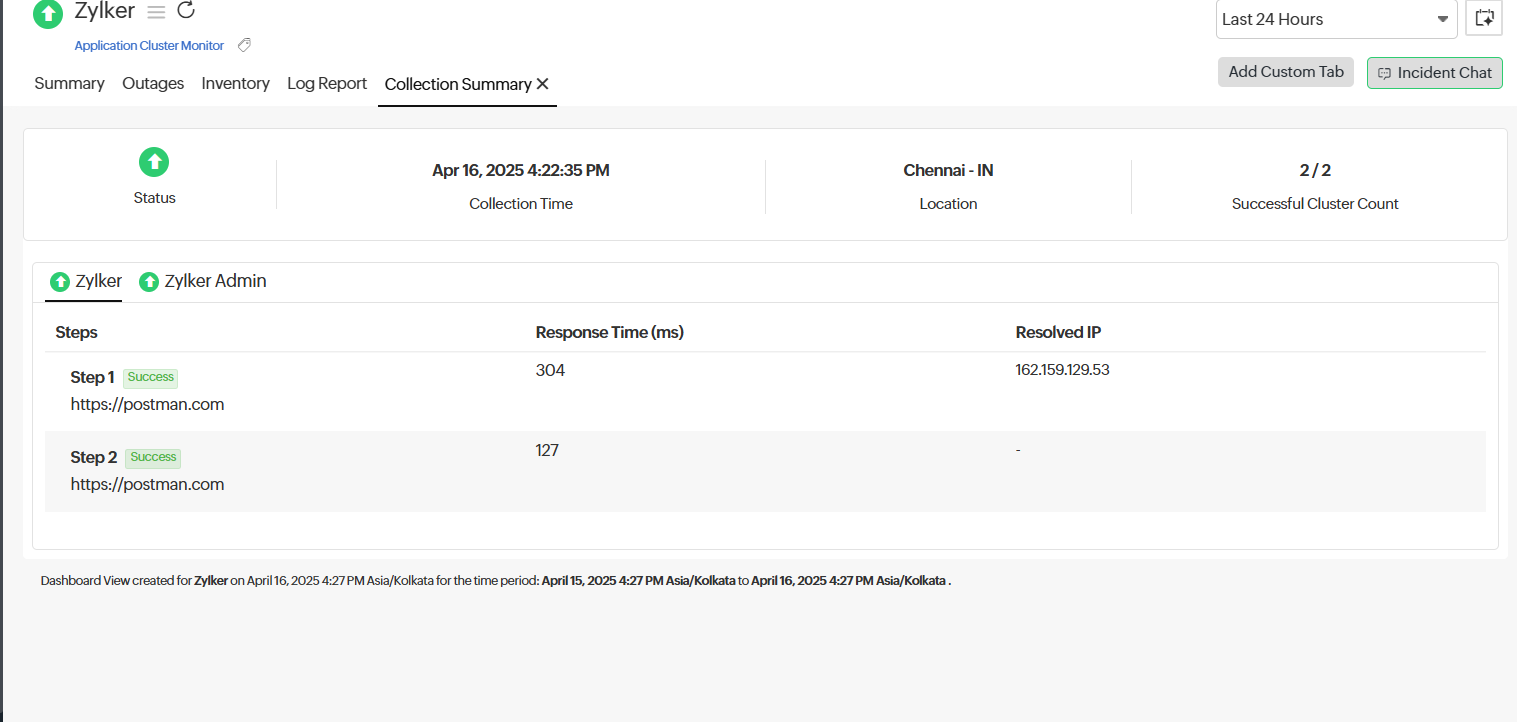
The Collection Summary tab provides a detailed breakdown of the execution status of each step in an application cluster monitor. It displays the collection time, location of execution, and the number of clusters successfully monitored.
Each step within a monitor includes the response time, resolved IP (if applicable), and success status. This view helps you quickly assess step-wise performance and identify any issues at specific stages in the monitoring sequence.

