Enterprise-grade website uptime monitoring that goes beyond basic ping checks. Track availability, response times, content integrity, and SSL certificate health from 130+ global locations with checks as frequent as every 30 seconds.
No credit card required · 30-day full-feature trial · Free plan available








Uninterrupted online presence is crucial to establish a brand’s identity, and if uptime isn’t monitored, it can result in:

Downtime halts online operations, disrupting critical business workflows and causing immediate financial impact.

Every minute your site is unreachable translates directly into lost sales and missed conversion opportunities.

Frequent outages create a perception of unreliability, eroding trust among your target audience.

Users expect instant access; unmonitored downtime leads to frustration and drives customers to competitors.

Spikes in support tickets regarding site accessibility can overwhelm your staff during an outage.

Internal processes that rely on web-based tools stall, causing delays and lost productivity across teams.

Unexplained downtime can sometimes be the first indicator of a DDoS attack or other security breaches.

Search engines demote sites with poor availability, significantly impacting your organic visibility.
For organizations that depend on their web presence for revenue, customer engagement, or internal workflows, website uptime monitoring is not optional—it is a core operational requirement. A dedicated monitoring solution checks your endpoints at high frequency from multiple geographic locations, validating not just that the server responds, but that it returns the correct content, within acceptable response times, with a valid SSL certificate.
Without this layer of observability, outages slip through the cracks. A regional DNS failure may only affect users in a single market. A content delivery issue might serve stale pages while returning a 200 status code. An expiring SSL certificate can trigger browser warnings that silently drive away traffic. A defacement attack might alter page content without causing downtime. Enterprise-grade website uptime monitoring catches all of these scenarios—before end users file support tickets.
The difference between basic ping checks and comprehensive website uptime monitoring lies in depth: multi-protocol support (HTTP, HTTPS, DNS, SMTP, FTP, TCP ports), content integrity verification using keyword-based content checks that detect unauthorized changes or missing elements, SSL/TLS certificate tracking with configurable expiry alerts, and response time threshold alerting that warns you when pages load slower than your SLA targets. When combined with root cause analysis, SLA reporting, and real-time status pages, website uptime monitoring becomes the foundation of a trustworthy digital operation.
Go beyond basic HTTP checks with our specialized website uptime monitoring tools. Our suite ensures maximum availability by tracking every layer of your digital infrastructure, reducing the risk of unexpected downtime.

Monitor HTTP and HTTPS endpoints from 130+ locations, verify content with keyword checks, and get alerted on status errors, content mismatches, and response time breaches — all in one platform.
Check the availability of your network devices. Use Ping (ICMP) to verify reachability and Port monitoring (TCP/UDP) to ensure specific services like SMTP, FTP, or SSH are running.
Monitor your DNS servers to ensure they are resolving domain names correctly and quickly. Detect DNS spoofing or cache poisoning issues early.
Get notified before your SSL certificates expire. Monitor certificate validity and revocation status to maintain a secure and trusted website.
Monitor scheduled cron jobs, background tasks, and data pipelines — get alerted when a job fails, runs too long, or produces errors, from the same platform as your uptime checks.
Monitor the availability and performance of your outgoing (SMTP) and incoming (POP/IMAP) mail servers to ensure reliable email communication.
Get uptime checks performed every 30 seconds
Obtain insights from more than 130 global vantage points
Run internal network monitoring using our On-Premise Poller
Gain AI-powered root cause analysis insights
View the status of your websites easily with the NOC view
Customize alert-related settings and stay informed
Integrate seamlessly with multiple third-party services
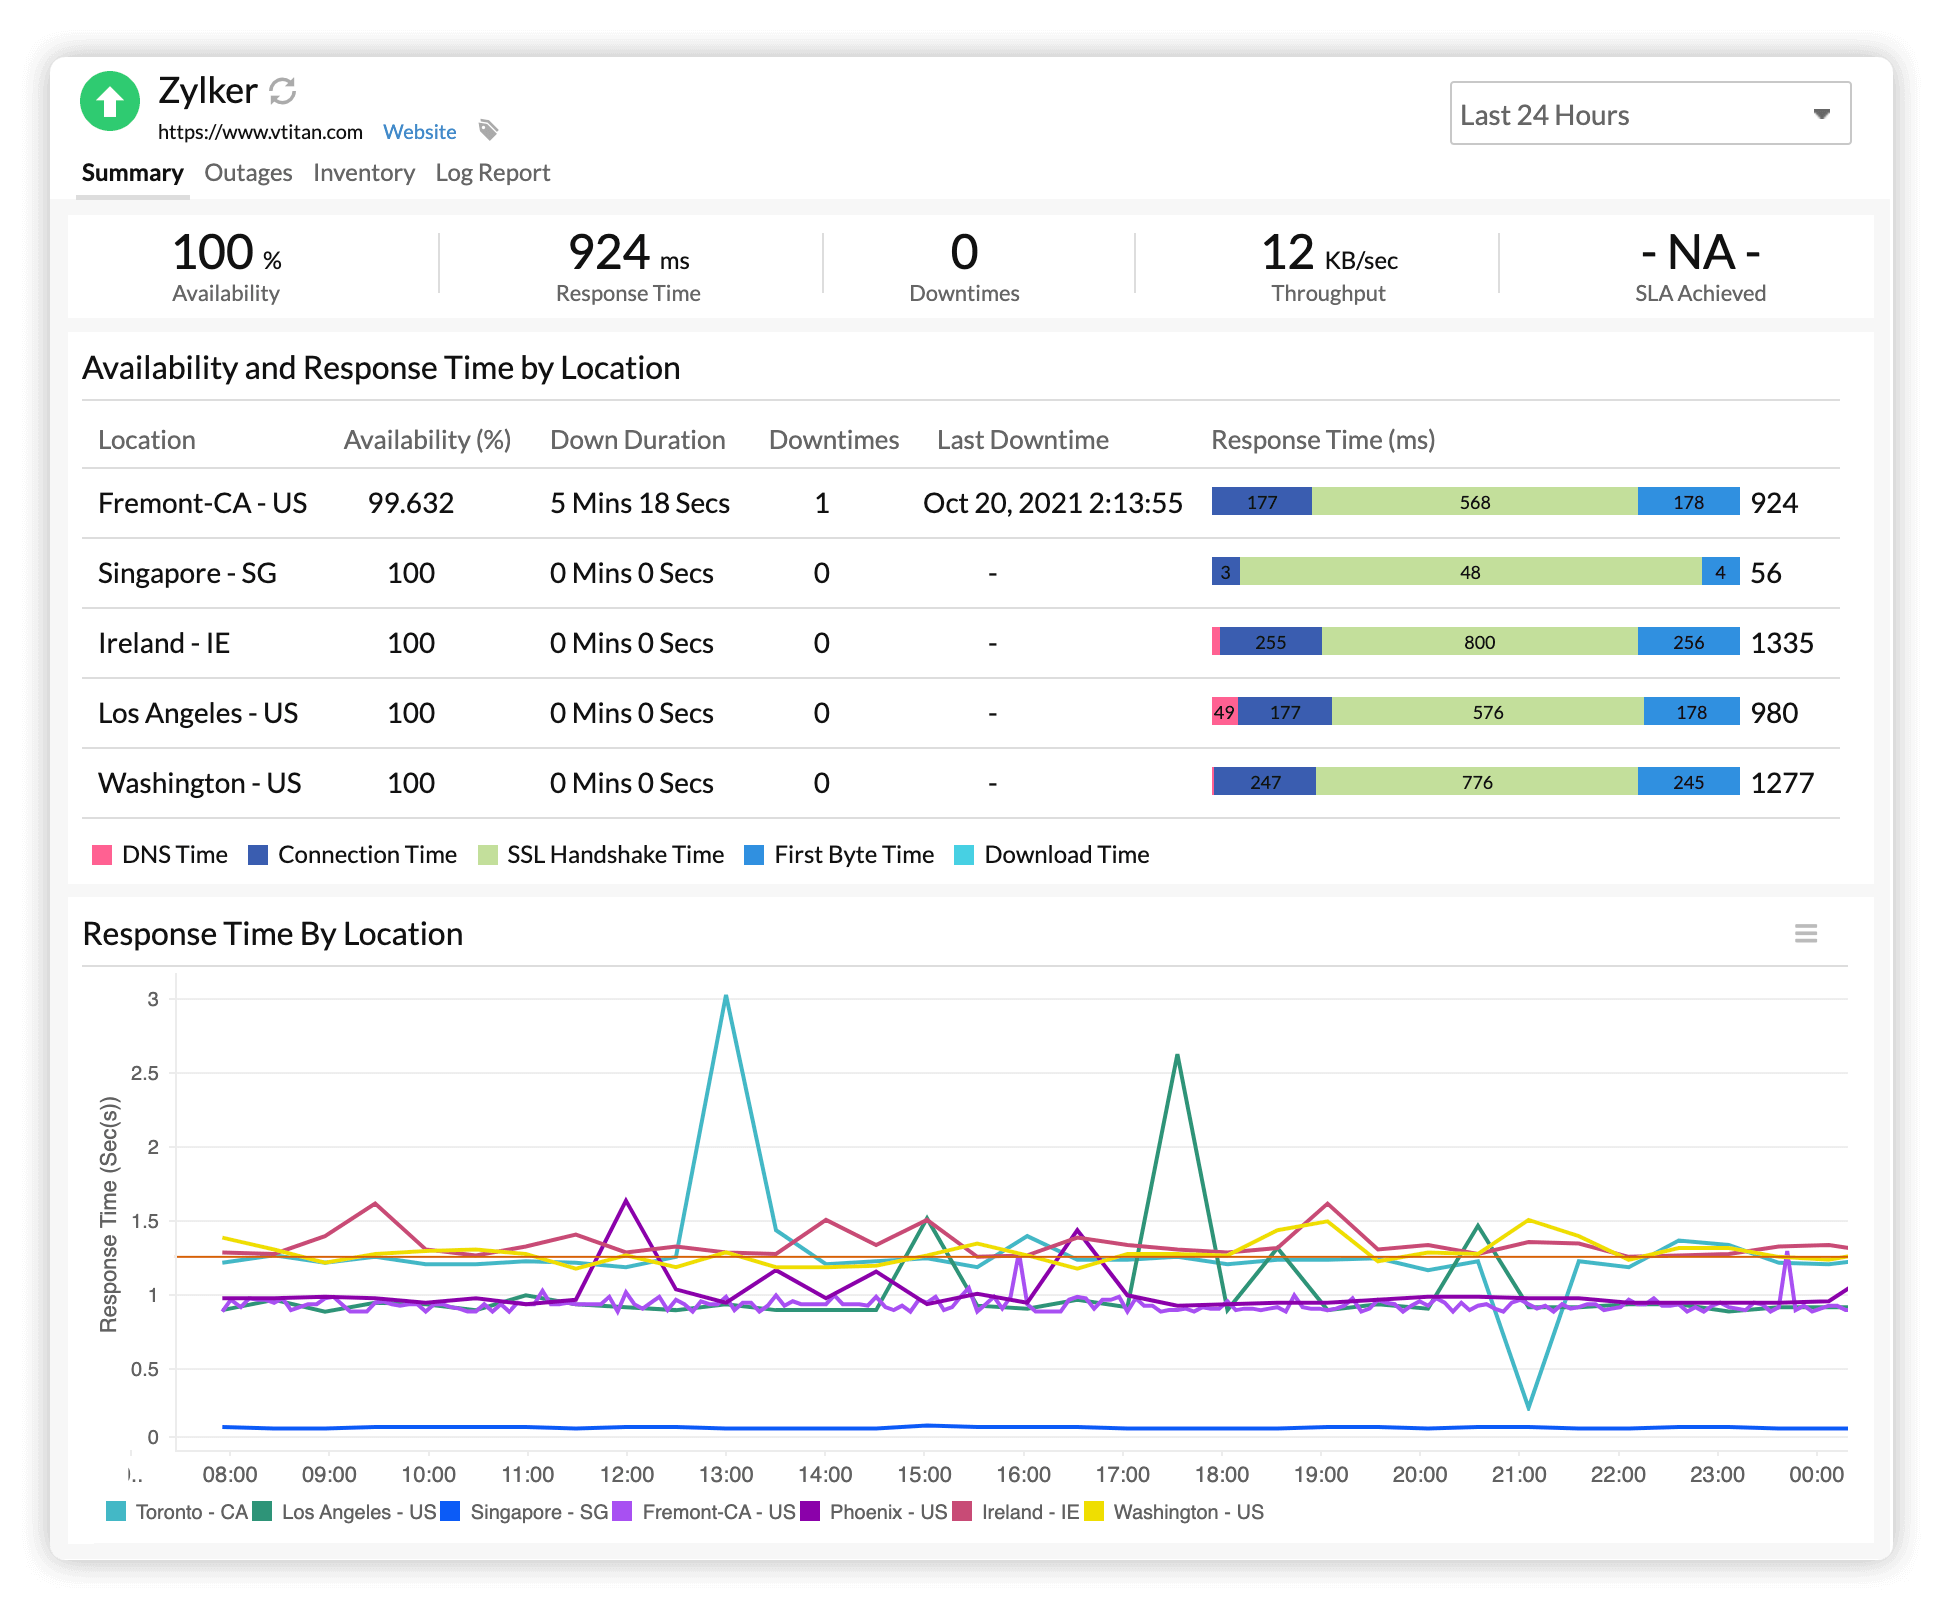
Quickly view the reason behind an outage and resolve issues faster. Obtain detailed traceroute paths, analyze web server output, and check DNS connectivity during incidents to minimize resolution time.

Define uptime targets, track real-time compliance, and generate SLA reports that satisfy customer contracts and compliance audits. Set custom thresholds per monitor to match the availability commitments specific to each service tier.

Set warning and critical response time thresholds per monitor and receive alerts via email, SMS, voice, Discord, or Telegram. Multi-location rechecks filter false positives automatically before an alert reaches your team.

Gain a bird's-eye view of the status of all your monitors and customize your NOC control panel.

Obtain detailed availability and performance summary reports and more to evaluate the uptime trends of your monitors.

Monitor the uptime of your resources with availability percentages displaying up to four-digit accuracy.

Integrate with third-party ITSM tools like Jira, PagerDuty, or ServiceNow, and connect uptime data with broader observability suites like Real User Monitoring (RUM) and Application Performance Monitoring (APM).

Manage your website uptime monitors from anywhere with dedicated iOS and Android apps. View real-time dashboards, acknowledge alerts, access RCA reports, and adjust monitor configurations on the go.

Keep your customers in the loop during downtime with highly customizable, multilingual public status pages that include seamless subscriber management capabilities.
Log in to Site24x7 and create your website uptime monitor to track availability and performance within a few seconds.
Opt to receive notifications through your preferred modes, including the ITSM tools you use, and choose who will be notified and when based on their business hours.
Get notified in case of issues; use the detailed reports, dashboards, and RCA to drill deep and resolve them before they impact users.
Website uptime monitoring is the automated process of constantly checking a website or web service to verify it is online, responding correctly, and accessible to users. It simulates global user requests, analyzes the availability and response times, and sends immediate alerts if an outage or performance degradation is detected.
Site24x7 offers customizable uptime checks at intervals ranging from 10-30 seconds up to 30 minutes, an hour, or even a day, depending on requirements.
Yes, Site24x7 allows you to export uptime and performance reports in formats like PDF or CSV, schedule them for email delivery, or generate shareable public links for easy dissemination.
Site24x7 offers a wide range of notification modes like email, SMS, voice calls, push notifications, and integrations with ITSM tools (e.g., ServiceNow, PagerDuty)or collaboration platforms (e.g., Slack, Microsoft Teams).
Site24x7 uses an intelligent multi-location verification mechanism with configurable sensitivity tuning. When an initial check detects a potential outage, the system automatically triggers a recheck from one or more alternate monitoring locations before raising an alert. You can configure the number of secondary locations used for rechecks, adjust the failure count threshold (how many consecutive failures trigger an alert), and set polling frequency per monitor—giving you fine-grained control over alert sensitivity. This multi-step confirmation process filters out transient network blips, ISP-level routing issues, CDN edge failures, and other false positives, so your team only responds to confirmed incidents that genuinely affect end users. Combined with response time threshold alerts, you can separate true outages from gradual performance degradation and route each to the appropriate team.
Yes. The Site24x7 mobile app (iOS and Android) provides full monitoring visibility on the go. You can view real-time uptime dashboards, receive push notifications for downtime alerts, acknowledge incidents, access root cause analysis reports, and configure monitor settings—all from your mobile device. The app also supports biometric authentication for secure access.
Uptime monitoring focuses specifically on whether a resource is reachable and responding. Website monitoring is a broader category that includes uptime checks alongside performance metrics (page load speed, Core Web Vitals), content verification, SSL certificate tracking, and synthetic transaction testing. Site24x7 combines both, so you get availability and performance visibility from a single platform.
Yes. Site24x7's On-Premise Poller lets you monitor internal websites, intranet portals, and private APIs that are not publicly accessible. The poller runs within your network and securely relays uptime and performance data to the Site24x7 cloud console, giving you the same dashboards, alerting, and RCA capabilities for internal resources as you get for public-facing websites.
Yes. Site24x7 lets you define custom response time thresholds for each monitor with separate warning and critical levels. When your website's response time exceeds the configured threshold, an alert is triggered—even if the site is technically online. This helps you detect performance degradation early, before it escalates into a full outage or impacts user experience. Thresholds can be configured per monitor, per location profile, and combined with escalation policies to route performance alerts to the appropriate team.
Content integrity monitoring (also known as content checks) verifies that your website returns the expected content on each poll. You can configure "should contain" keywords that must be present in the response body, and "should not contain" keywords that trigger alerts if detected. This catches scenarios like website defacement, broken deployments serving error pages with a 200 status code, CDN serving stale content, or content injection attacks—issues that a basic HTTP status check would miss entirely.
Want to learn more?
Interested in our services?
